

Interactive Maps
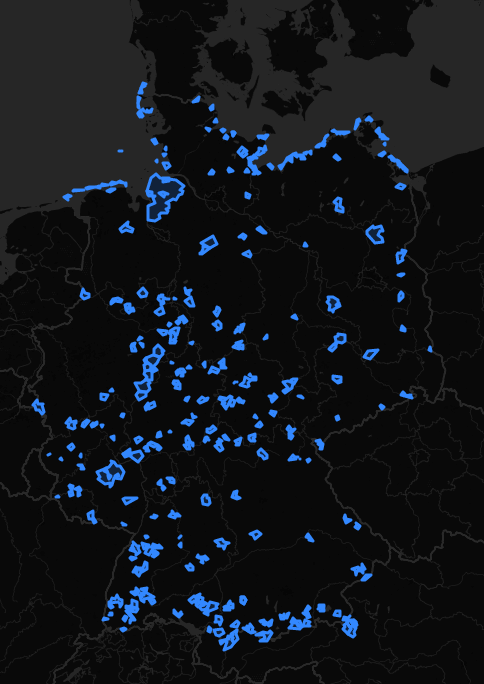
German Health Resorts
Using the Wikipedia list of German health resorts, we processed it through Nominatim from OSM, simplified the outlines, and transformed the data into a GEOJSON collection using Python scripts. Nominatim geocoding API 💕 found only 320 from 380 entries, so the list is not complete.
![]()
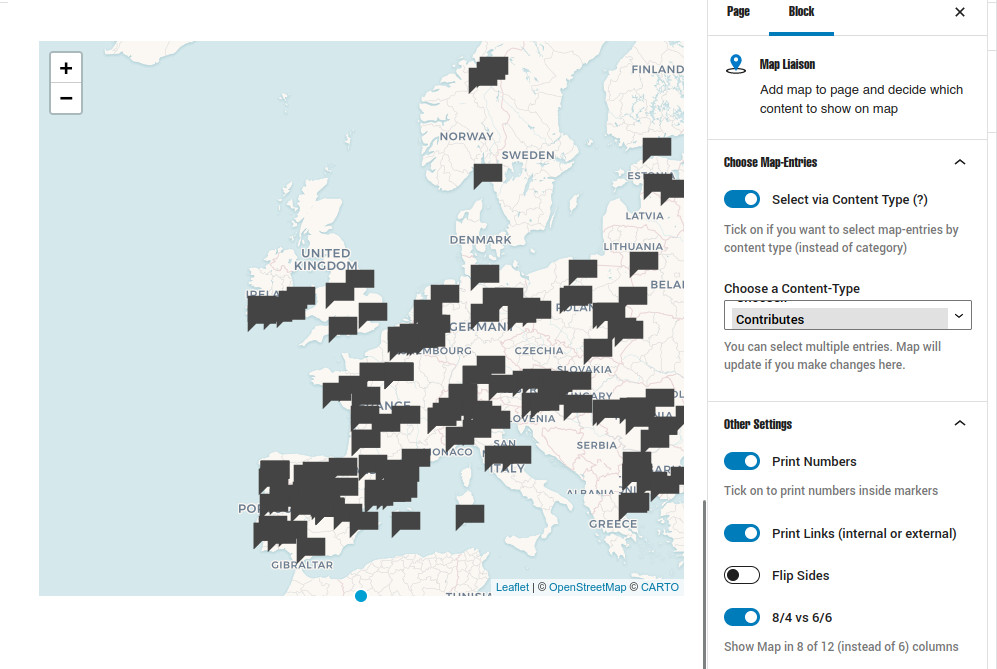
Interactive Maps managed via WordPress
In 2020 I was working with leaflet maps for a EU-research project. One task was to show some 100-200 contributions on an interactive map.
It allows to do some simple keyword search on markers content and also interact with markers and text-based presentations in a bilateral way.
Since the whole site runs on WordPress and the contributions are custom post-type items, I build a Gutenberg block allowing to manage the various interactive maps.
![]()
Inspecting the Names used by German Non-Profit Organizations
in 2014 I made this interactive visualization.
The tech is old (jQuery) but the data is still interesting.
How to use:
- choose a topic
- click on a word in the word cloud
- click on one of the federal state to show more numbers
Where does the data come from?
Back in 2014, we developed a scraper to collect information about non-profit organizations in Germany. The data was primarily sourced from vereinsregister.de. Only the name of the non-profit is used to generate the graphics, so the thematic matching may not always be very strong.
Nevertheless, some interesting insights can be derived. The categories in the word cloud were manually created. We defined the semantics of each category, then counted the occurrence of each word in the database. This process did not involve complicated data science, just basic counting.
![]()